> For the complete documentation index, see [llms.txt](https://gut-analysis-toolbox.gitbook.io/docs/llms.txt). Markdown versions of documentation pages are available by appending `.md` to page URLs; this page is available as [Markdown](https://gut-analysis-toolbox.gitbook.io/docs/1.-choosing-the-right-parameters.md).
# 1. Choosing the right parameters
It is recommended to test the GAT segmentation on representative images of neurons first before running the entire workflow. These macros can be found under `GAT->Tools` and will have "Test" as a prefix. This is to ensure that the segmentation is accurate.
There are 3 important parameters in GAT that may require fine tuning:
* Probability
* Rescaling Factor (dependent on pixel size)
* Overlap Threshold
We will go into more detail about each and how to optimise them.
The general workflow would be to **`test different rescaling factors first, followed by different probability thresholds`**. There are scripts within GAT -> Tools that make it easy to test a range of values.
### 1.1 Optimising GAT segmentation
{% tabs %}
{% tab title="Rescaling Factor" %}
The models within GAT are trained to segment neurons with mean area of: 701.2 ± 195.9 pixel2 (Mean ± SD, 6267 cells). As images can be acquired at different resolutions (pixel sizes), it is important that the image be rescaled so the cells are of a similar area (in pixels) to what the model/s have been trained on. This is done by specifying a `rescaling factor`. By default, the rescaling factor within GAT is 1. However, you can test a range of values to ensure you use the most accurate value. If the rescaling factor is too big, it will split your cells, if it's too small, cells are merged. This is illustrated in the image below:
* *yellow arrowheads: merges*
* *white arrowheads: splits*
* *asterisk: false positive*
#### Recommended rescaling factor range:
* Adult Mouse: 0.9 to 1.2
* Adult Human: 0.5 to 0.7
> If your cells are being over-segmented or split, increase the rescaling factor, if they are being merged, decrease the rescaling factor.
>
> Please use a value that works accurately on your dataset.
For earlier versions of GAT, click [here](#1.6-pixel-size-to-rescaling-factor-conversion) to see conversions from pixel size to rescaling factor.
### Determining the right rescaling factor
To make testing easier, if you have a large image, you can crop it and test a small region.
* Ensure your images are calibrated. Open your images in FIJI and go to `Image` -> `Properties` on the FIJI menu.
It should state the pixel width and height in microns. If not, please enter this manually. GAT will only work properly if this information is entered.
* Go to `GAT` -> `Tools` -> `Test neuron rescaling`
For this example, one of the [sample images](https://github.com/pr4deepr/GutAnalysisToolbox/tree/main/Sample%20Images) will be: [181107\_ms\_distal\_colon\_nNOS\_GFAP\_Hu\_40X.tif](https://github.com/pr4deepr/GutAnalysisToolbox/blob/main/Sample%20Images/181107_ms_distal_colon_nNOS_GFAP_Hu_40X.tif)
Channel 3 is “Hu” labelling of the neuronal soma.
* Click on `Browse`, navigate to the image and click OK.
*Tip*: If you already have an image open, you can tick the box `Image_already_open`.
* As a start, its recommended to test a rescaling factor of 1. Enter the same value for minimum and maximum value to test only one rescaling factor.
* Keep the rest as shown in the image above.
* Click OK and it will open the image. As it’s a multichannel image, it will ask you to verify the channels so you can choose your channel of interest in the subsequent prompt.
* Moving the slider on the bottom will cycle through the 3 channels. Hu is in channel 3.
* Enter 3 in the next box and click OK.
It will now perform segmentation of the neurons using the settings entered above. As we are only testing one rescaling factor, we will get one resulting image with ROIs overlaid on it.
Keep in mind that this image has been resized and segmentation performed on this image to obtain the ROIs. Use this step to zoom into the image and verify the segmentation is working. If you’re not happy, you can test a range of values. If you’d like to test a range of values, close all the images and rerun “Test Segmentation”. In the dialog box, enter the minimum and max values. Here I’m testing 0.7, 0.8, 0.9, 1, 1.1, 1.2, 1.3 and 1.4. For this, I’ve entered
* Minimum value: 0.7
* Maximum value: 1.4
* Increment step/s: 0.1 Click OK and enter channel 3 as above in the next prompt.
* This will yield a series of images with different pixel sizes and the resulting segmentation overlaid.
The rescaling factor used will be in the image name. You can check the Log window to see the number of objects for each rescaling factor. It is recommended to test this on images you may have already counted or small regions manually analysed to verify the accuracy.
**Default value in GAT is 1**
{% endtab %}
{% tab title="Probability" %}
The model within GAT returns an image with probability or likelihood of pixels within an image belong to a cell. The values it return are from 0 to 1, with 1 being super confident. When you set a probability value in GAT, you are setting a threshold, where a higher value will lead to less objects and a lower value will lead to more objects. This can be useful if your image is quite bright and the model is picking up background or faint objects as being cells.
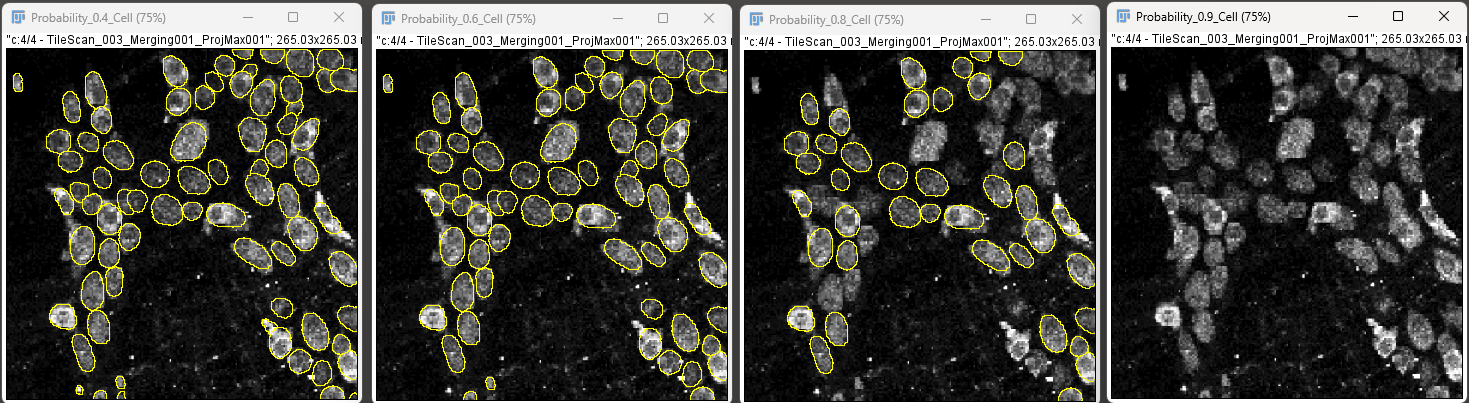
For example, the image below demonstrates cell detection with probability thresholds of 0.4, 0.6, 0.8 and 0.9.
Testing probability of 0.4, 0.6, 0.8 and 0.9. Higher the probability, lower the number of objects detected.
> High probability yields lower number of objects and reduce false positives, whereas lower probability will give more objects and thus reduce false negatives.
### Determining the right probability
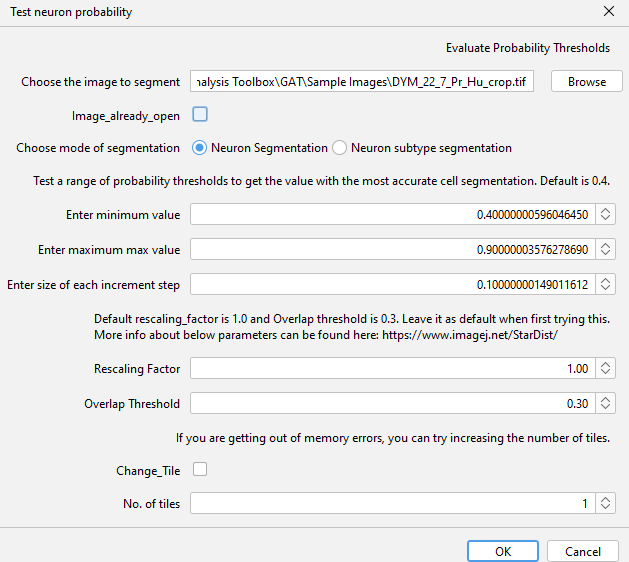
* To determine the right probability value for your image, you can go to `GAT` -> `Tools` -> `Test neuron probability`
* You can test this by downloading this [sample image, with cropped Hu channel](https://zenodo.org/doi/10.5281/zenodo.10590347).
* You can select `mode of segmentation` as `Neuron segmentation`.
* If your image is of a neuronal subtype such as ChAT, nNOS etc.., then select `Neuron subtype segmentation`.
* Enter the range of probability values: 0.4 to 0.9 and increment of 0.1
* Keep everything else the same for now.
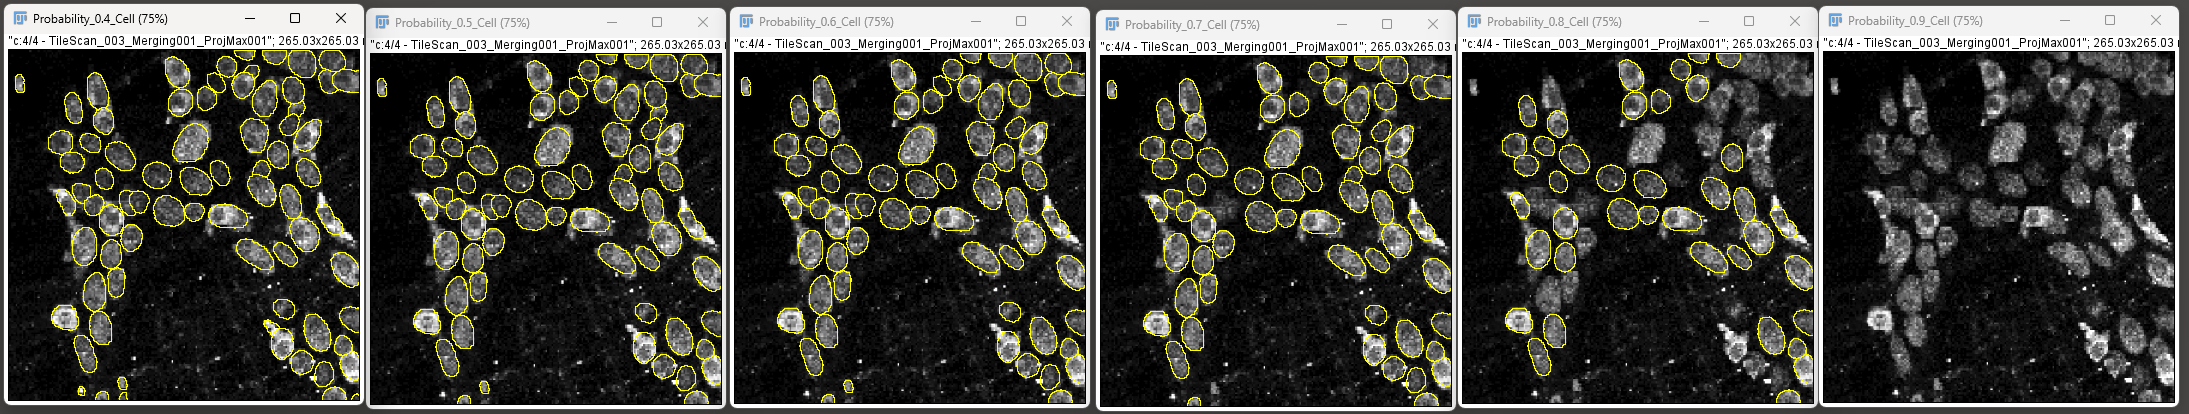
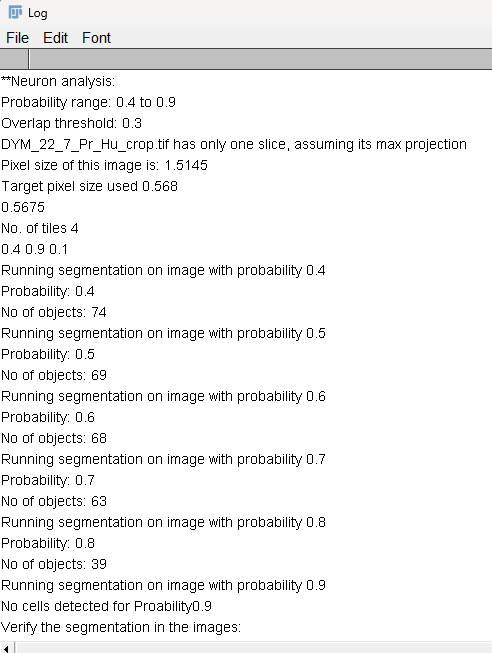
* When you click Ok, GAT will process each image and when done will display all the different outputs.
* The log window will also display the number of objects for each probability value.
This can help you figure out the right probability value. Use the same workflow for neuronal subtypes as well.
The other parameters that can be adjusted within GAT is the “Probability” and “Overlap Threshold” of the StarDist segmentation.

Default **probability** values in GAT:
* Neuron: 0.5
* Neuronal subtype: 0.4
`Lowering Probability will help in detecting low stained cells or dim areas. However, it can also pick up background or false positives. Increasing probability will reduce the number of detected cells and keep bright objects.`
{% endtab %}
{% tab title="Overlap Threshold" %}
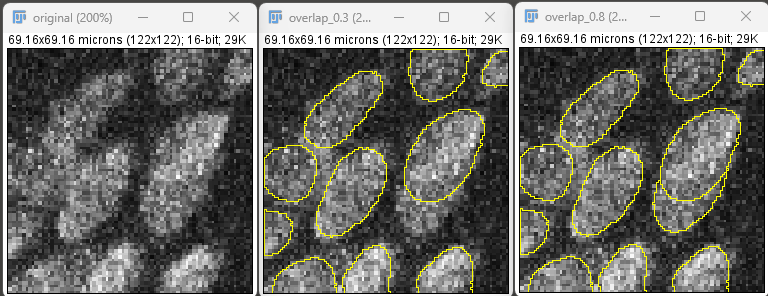
Lowering overlap threshold will increase detection of overlapping cells, but it may start detecting more cells where there aren’t. The default value may work in most cases. It is recommended to lower this if the tissue isn’t stretched well and cells are on top of each other. Increasing this will lower the number of overlapping cells detected.
Increasing the overlap leads to higher chance of detecting overlapping cells. Original (left), overlap 0.3 (middle) and overlap 0.8 (right)
The reality is that if the tissue is not stretched properly and you cannot differentiate between cells by eye, then it is unlikely that GAT will be able to detect cells accurately in a 2D image. This is particularly the case if the cells are overlapping heavily.
*Tip*: You can use [QuPath](/docs/6.-qupath-for-analysing-ens.md) for analyzing large 2D tilescan images as well
**Default value in GAT is 0.3, ranges from (0 -> 1).**
{% endtab %}
{% endtabs %}
The above parameters are all entered into the StarDist plugin in Fiji. For more details about StarDist and how it works, refer to this [FAQ](https://stardist.net/docs/faq.html).
### 1.2 Testing segmentation on a tilescan/large image
* Open a large tilescan image in FIJI. You can select `Tilescan_GAT_ms_distal_colon_MP_hu.tif` from the [sample images.](https://zenodo.org/doi/10.5281/zenodo.10590347) Select the rectangle tool and draw a rectangle around region you’d like to test the segmentation.
* Right click outside the ROI, click duplicate followed by OK and you will get just that region as a separate image.
* Go to `GAT` -> `Tools` -> `Test Neuron rescaling`.
* As the image is already open, tick `Image_already_open`.
* Use the following settings:
* Click OK. It will ask you to select the image as we selected the image already open box. Select the cropped image and click OK.
* It will now cycle through the rescaling factors, resize the images and run segmentation on them.
* In the Log window, you will see the no of detected objects at each rescaling factor with corresponding pixel size:
### 1.3 Pixel size to rescaling factor conversion
Earlier versions of GAT used pixel size for segmentation. This was confusing and instead we have introduced a rescaling factor. To convert from pixel size to rescaling factor you can divide pixel size by 0.568. Example conversions:
| Pixel size (micron /pixel) | Rescaling Factor |
| :------------------------: | :--------------: |
| 0.9 | 0.63 |
| 0.568 | 1 |
| 0.5 | 0.88 |
| 0.45 | 0.79 |
Keep in mind this is the pixel size you would like to rescale the image to so that the algorithm performs accurate segmentation. It is not the pixel size of your image.
---
# Agent Instructions
This documentation is published with GitBook. GitBook is the documentation platform designed so that both humans and AI agents can read, navigate, and reason over technical content effectively. Learn more at gitbook.com.
## Querying This Documentation
If you need additional information that is not directly available in this page, you can query the documentation dynamically by asking a question.
Perform an HTTP GET request on the current page URL with the `ask` query parameter:
```
GET https://gut-analysis-toolbox.gitbook.io/docs/1.-choosing-the-right-parameters.md?ask=
```
The question should be specific, self-contained, and written in natural language.
The response will contain a direct answer to the question and relevant excerpts and sources from the documentation.
Use this mechanism when the answer is not explicitly present in the current page, you need clarification or additional context, or you want to retrieve related documentation sections.