🔢2. Cell counts and ganglia analysis
Sample data
You can download the sample data used in this guide from the following link: Sample Data.
2.1 Analysing number of neurons
Neurons can be detected in a field of view as long as the cells are stained with Hu, a pan neuronal marker that labels the cell soma. The workflow below will show you how to analyze the number of neurons.
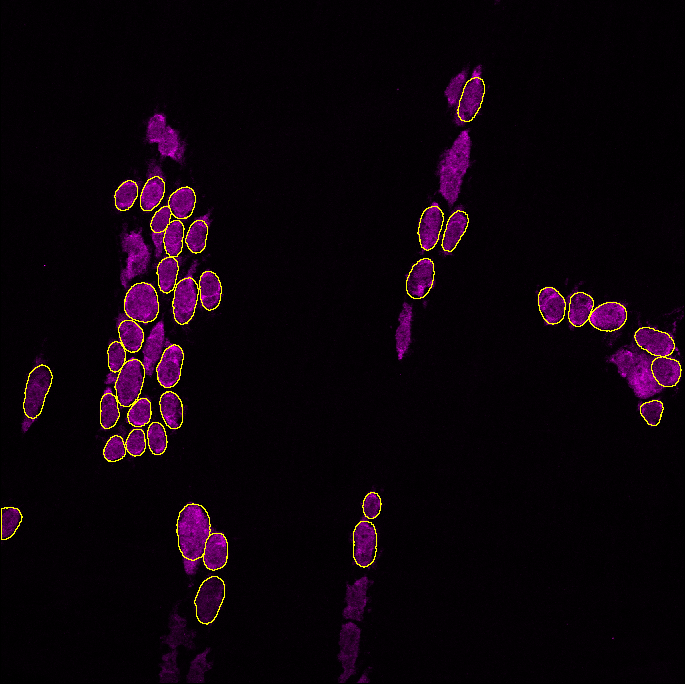
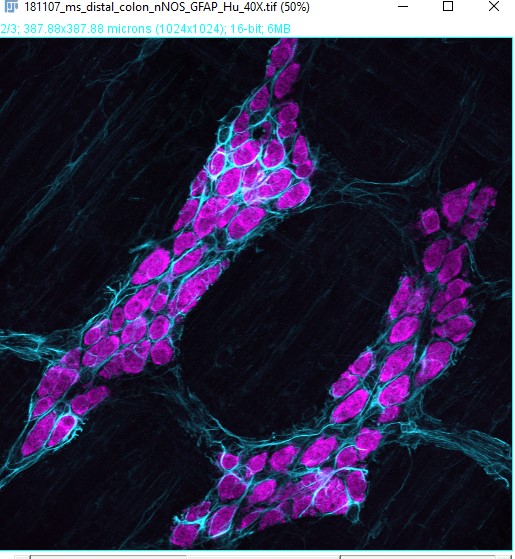
Sample image used for example below: GFAP/Hu
Select GAT -> Analyze Neurons


For this image,
Channel 1: GFAP
Channel 3: Hu
As we are only interested in the number of neurons, we enter the channel number for Hu. If you do not know, enter NA into the field. You will have the option for entering it earlier, however, it is easier to prefill information as much as possible.


We will use the default pixel size, probability and overlap threshold values. Click OK when done.
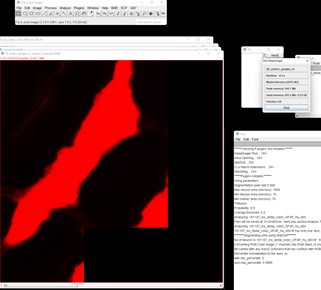
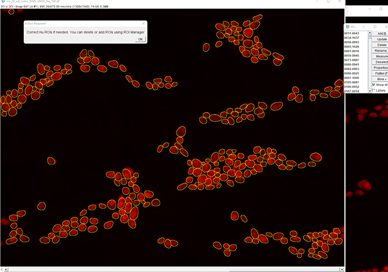
GAT will open the image and run the segmentation after which you will get the prompt below.


You can use this step to add or delete ROIs from the ROI Manager as you please. Once you are done, click OK.
Once the analysis is complete, you will have a folder called “Analysis” within which there will be a subfolder with the name of the image you analysed. This will contain:
Table with no. of neurons
ROI Manager with neuron outlines
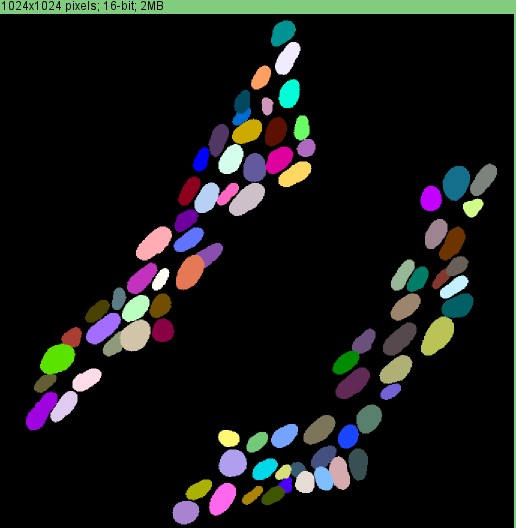
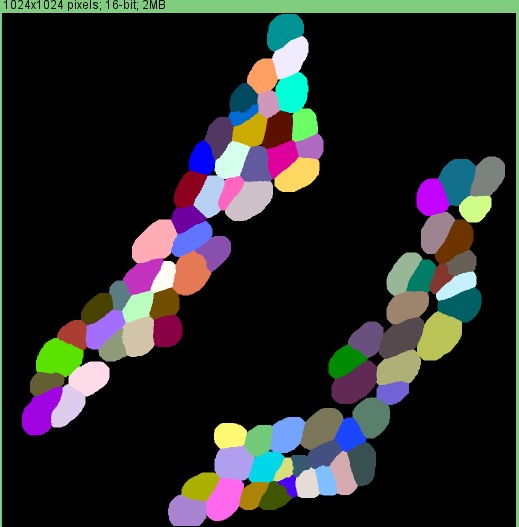
Label image where each neuron is an individual colour.


2.1.1 Optimising cell detection
On occasion, you may run the analysis and realize that the software doesn't detect all cells.
Within GAT, you can optimise the probability of detection during analysis, by ticking the "Finetune_detection_parameters" box, but we recommend testing parameters out first using "Test Neuron Probability" which is under GAT -> Tools :
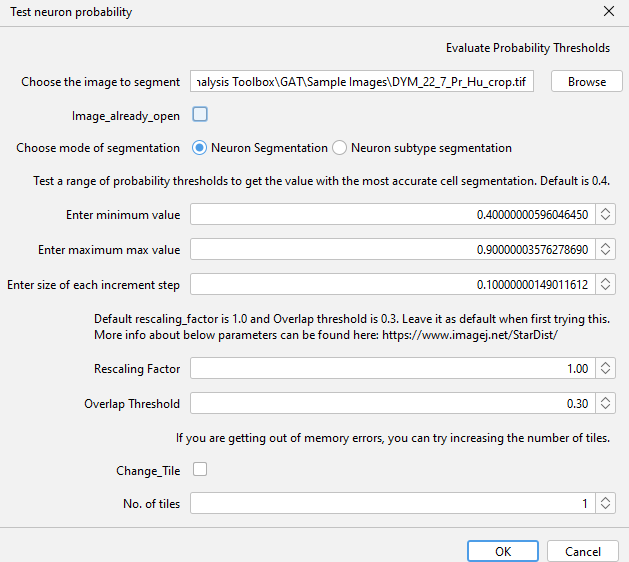
Increasing probability will detect brighter objects and reduce background detection, whereas decreasing probability will detect dim cells, but may pick up background. Refer to section 1 on using Test segmentation for choosing the right parameters.
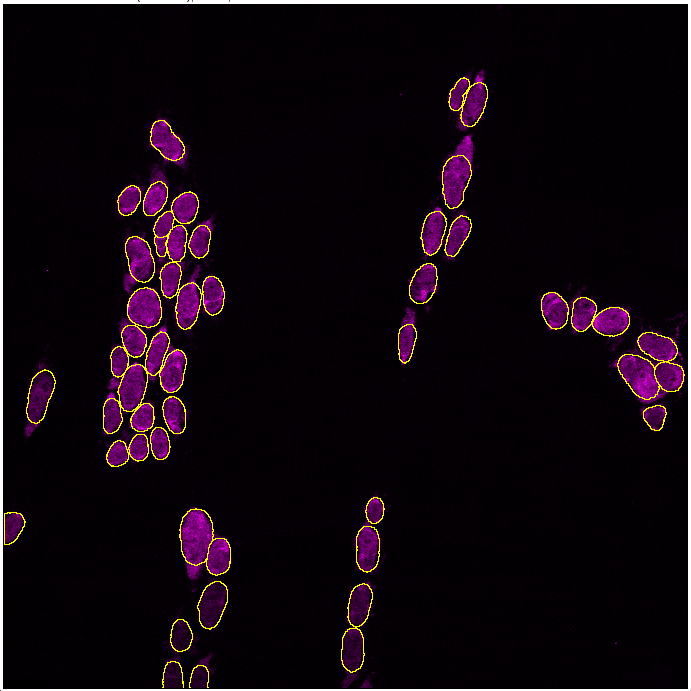
In the example above, decreasing the probability threshold gave better accuracy:
2.2 Segmenting ganglia
2.2.1 Two channels
In the above image, we had GFAP in channel 1 which can be used to detect the ganglia. This can be used to determine the no of ganglia and cells per ganglia.
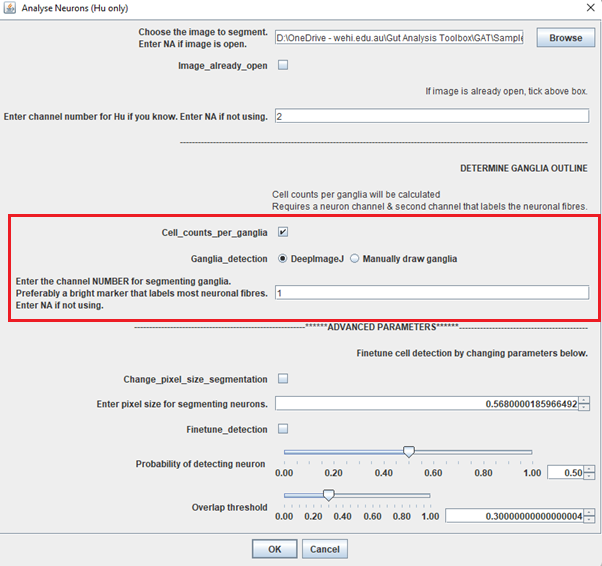
To do this, select
Analyse Neurons (Hu only) and make sure you tickCell_counts_per_ganglia. ChooseDeepImageJand enter the channel number for GFAP in the box.
Tip: It doesn’t have to be GFAP, it could be any channel that labels the neuron or glial fibres and/or soma. As long as you have a combination of Hu and a “ganglia” marker, you should be able to segment the ganglia.

Click OK and follow the same procedure as neuronal segmentation.
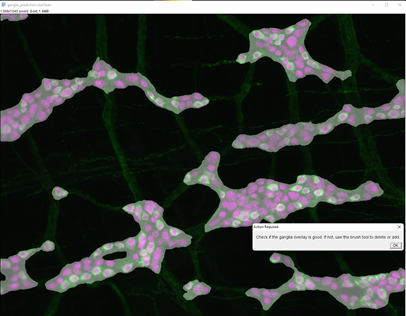
As we selected to count cells per ganglia, deepImageJ will be run to segment the ganglia based on colocalization of Hu and GFAP.

You can now correct the ganglia outline using the brush tool. Click on the image below to watch the instruction video:
2.2.2 Single channel
Hu staining can be used to define the ganglia. This requires the neuron ROIs. Essentially, the cells are expanded by a user-specified radius or distance. If they touch each other, they are part of the same ganglia. You can test this out using the Test_ganglia_segmentation_Hu_only script.
To perform the analysis, you select the Define ganglia using Hu option: 
A good starting value is around 12 microns. It's still experimental, so please use it with caution and make sure you run the tests using Test_ganglia_segmentation_Hu before using it for your analysis.
You can checkout the theory about this on here:
2.3 Detecting multiple markers
Please note that GAT expects multichannel images when studying different markers. Within FIJI, this is called a composite image.
2.3.1 Analysing a single neuronal subtype
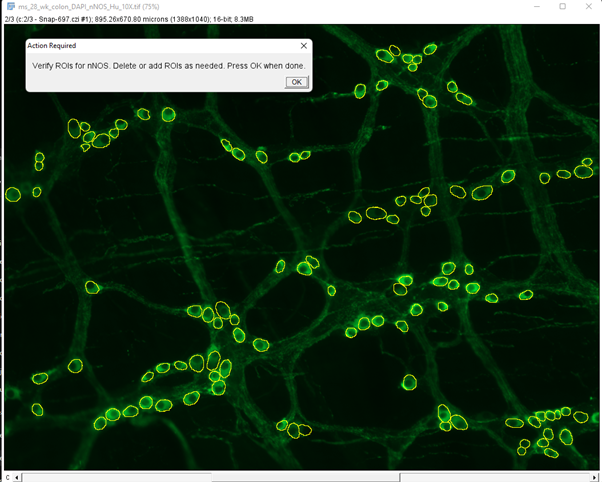
A common workflow in ENS research is to quantify the number of neurons, detect neuronal subtypes based on neurochemical coding and quantify the proportion of cells. We will use the sample image of the myenteric plexus of an adult mouse colon labelled with DAPI, nNOS (neuron subtype) and Hu (neuron). This image has:
Select
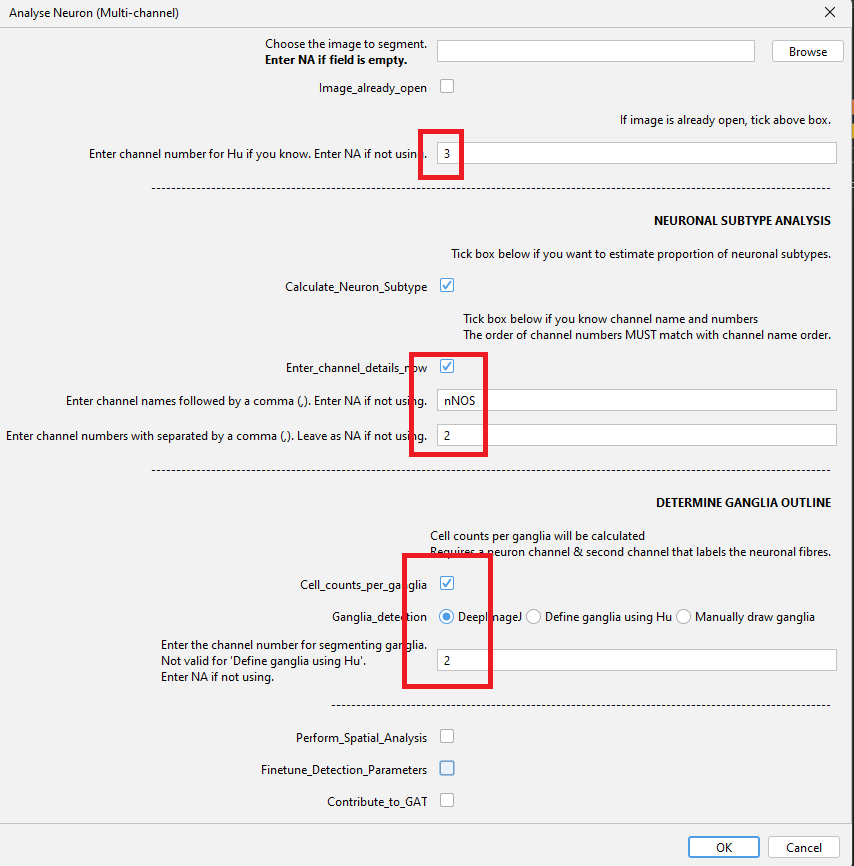
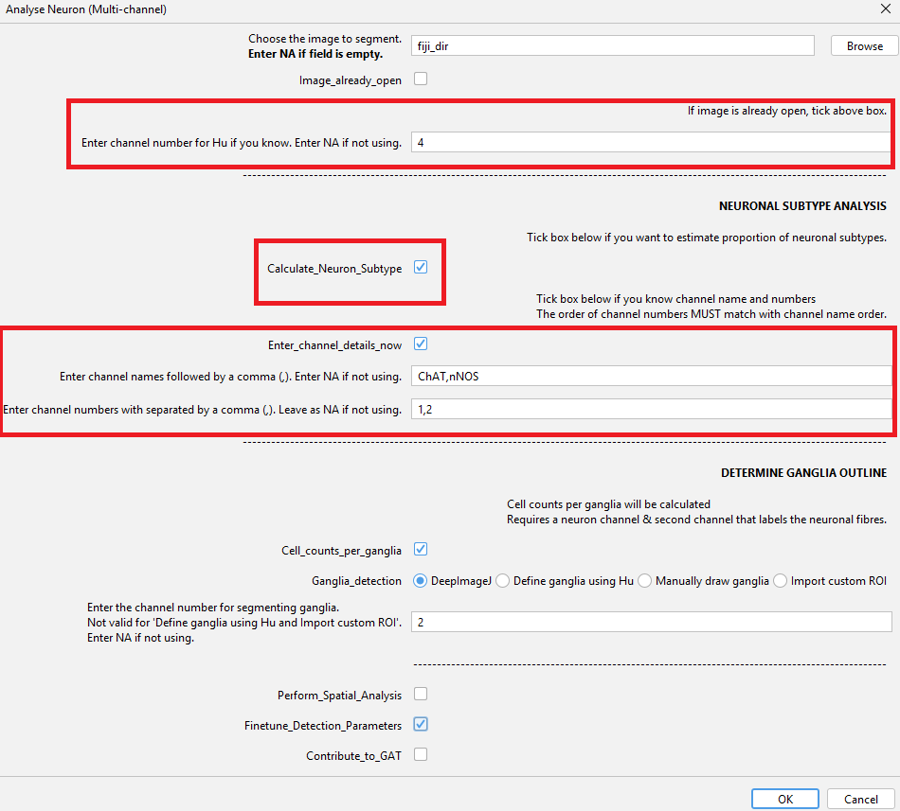
Analyse Neuron (Multi-channel)Enter the channel number for Hu.
Tick
Enter_channel_details_nowso you can enter the name (nNOS) and corresponding channel no. (2).Tick
Calculate_Neuron_Subtypeas we are going to analyse the no. of nNOS neurons and the proportion of Hu +ve neurons that are nNOS.Tick
Cell_counts_per_gangliato calculate cell no. per ganglia. Click OK when done.
1. Segmentation of neurons and verification.
It is extremely important to verify the neuron segmentation and prediction. This will be used as a basis for predicting nNOS cells. Click OK when you’ve verified neuron ROIs.
2. Ganglia segmentation and verification.
The ganglia below has been corrected. Check this video for more information on how to correct the ganglia outline.
3. nNOS segmentation and verification
In this step, the neuron subtype model is used to predict nNOS positive cells. This model “over predicts” the no. of cells and suggests more nNOS candidates than the image has. GAT then uses the Hu prediction from above and verifies if the nNOS candidate is a neuron. If not, the nNOS cell is deleted.
Click OK when you’re done and the following table will be displayed:

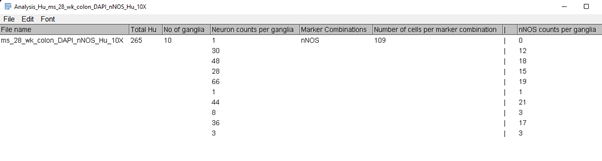
GAT will calculate:
No. of neurons
No. of ganglia
Neuron per ganglia
No. of nNOS neurons
No. of nNOS cells per ganglia
Ganglia Area (micron^2)
These results will be saved in the “Analysis” folder.
2.3.2 Analysing multiple neuronal subtypes
In many occasions, there is more than one neuronal subtype that needs to be analysed. Technically, there is no limit on the number of markers that can be analysed in GAT. For this workflow, we will use a dataset that GAT hasn't been trained on. We will use a sample dataset from the SPARC portal, which is also in the sample images folder. This image has the following channels:
Channel 1: ChAT (subtype)
Channel 2: nNOS (subtype)
Channel 3: VIP (subtype)
Channel 4: Hu (neuron)
For this workflow, we will look at the proportion of ChAT and nNOS neurons.
The order of the Channel names and the channel numbers must be the same. It can be entered like:
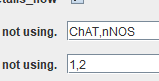
OR

The order should be the same in both rows. The channel for segmenting ganglia can be either nNOS or ChAT.
Video tutorial
As the analysis involves correcting ganglia outline and neuron numbers, it has been recorded as a video and published here (no audio):
The resulting table from the analysis will have:
No. of neuron
No. of ganglia
Neuron per ganglia
Marker combinations
No. of nNOS neurons
No. of ChAT neurons
No. of ChAT+nNOS neurons
No. of nNOS cells per ganglia
No. of ChAT cells per ganglia
No. of ChAT+nNOS cells per ganglia
It is possible that the model files may not work well for your set of images or you may your own segmentations from another software. Please refer to section about "Segmentation" for more information.
2.3.3 Analysing multiple neuronal subtypes (without Hu) - experimental
We have added an option to analyse multi-channel images without Hu. It is still experimental, but it allows flexibility to analyse neuronal subtypes without the need to label all neurons.
The caveat is that the ganglia segmentation will not be accurate and may need significant manual adjustments. Alternatively, it may save time to manually outline it instead of using the automated options like DeepImageJ.
Dataset reference:
2.4 Custom ROIs
Given the evolving landscape of cell segmentation software, it is likely that other software could do a better job at detecting cells in your dataset. If you can save these images as an ROIManager.zip file, then you can import it into GAT during your workflow.
For example, if running the 2.3 Detecting multiple markers workflow, you can choose to import a custom ROI for a marker of interest. Just make sure to tick Finetune_Detection_Parameters when starting analysis.

When you do so, you will be able to finetune the StarDist detection parameters OR import custom ROIs.
In this example, before neuronal detection, you will get a box like this:

As we want to import a custom ROI, we tick that box and in the next window will be prompted to select the ROIManager file.
Tip: Even if the ROIManager file has non-neuronal cells, it will only keep the cells that overlap with the neurons detected in this workflow.
You can do this for multiple markers, if needed.
Last updated