🗺️3. Spatial Analysis
Sample data
You can download the sample data used in this guide from the following link: Sample Data.
Introduction
The aim of spatial analysis within GAT is to characterise the distribution and the spatial relationships of cells and cell types in the gut wall. However, a lot of spatial analysis is based on distance-based measurements, and the stretching of gut tissue for wholemount preparations can make this analysis a bit complicated.
GAT offers two options for spatial analysis:
Number of cells per ganglia (frequency distribution)
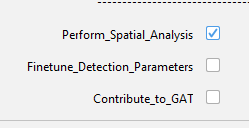
You can perform spatial analysis as part of the routine workflow, just tick the box Perform Spatial Analysis.
Default value for cell expansion in adult mouse tissue was estimated to be: 6.5 µm. This is dependent on stretch, so please use this with caution and experiment with a few different values on your image.
The following sections go through the details on the spatial analysis workflows if you choose GAT -> Spatial Analysis. Otherwise, the analysis results are the same as if you did it in the main workflow.
3.1 Nearest Neighbours
Background: The greater the number of cells, the larger the number of neighbours surrounding each cell. This can be used as to characterise any changes in cell distribution within the gut wall. For a cell to be considered a neighbour we still have to specify a maximum distance range within which it is considered a neighbour. This parameter can be affected by tissue stretch, so, the distance between neurons within a ganglia was objectively assessed within images of mouse tissue with varying levels of stretch. The distance between cells in the ganglia was measured using the local thickness plugin within FIJI.


The value was determined to be 6.32 ± 5.17 µm (n=3643 cells, 130 ganglia, Mean ± S.D., N=11), which is rounded to 6.5 µm for ease of use within GAT. This was only determined for mouse tissue. So, for analysis in mouse tissue we have set 6.5 µm distance as a threshold radius within which cells are considered to be a nearest neighbour. Keep in mind that this distance is an edge to edge distance. GAT offers the option to customise this threshold value if needed.
Keep in mind that this value can still be affected by tissue stretch and must be tested on your images before settling on a value.
The number of neighbours can be estimated for
one celltype, for example, how many neighbours do each neuron have. If there is a reduction in number of neurons, the number of neighbours surrounding each cell must reduce as well.
two celltypes, i.e., if you are interested in studying distribution of nNOS, you would like to quantify how many nNOS neighbours do each neuron have. If there is a reduction in nNOS cells, ideally you should see a reduction of nNOS neighbours per cell.
We will be using a sample image with Hu and nNOS labelling for this workflow: 181107_ms_distal_colon_nNOS_GFAP_Hu_40X.tif
Prerequisite: You should have performed multichannel neuron count analysis in GAT and have the following files ready:

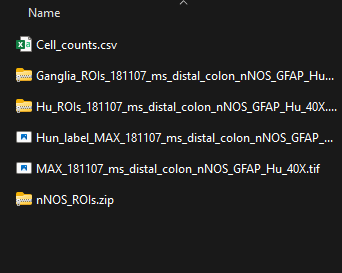
The Spatial analysis can be accessed here:

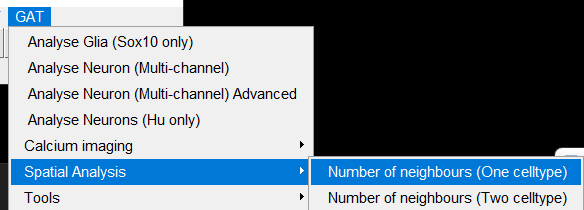
3.1.1 Single celltype analysis
In this workflow, we only need:
Maximum projection image
Neuron ROIs (Hu ROI file (.zip file))
ROI manager for ganglia segmentation (optional, but highly recommended)
Directory to save results

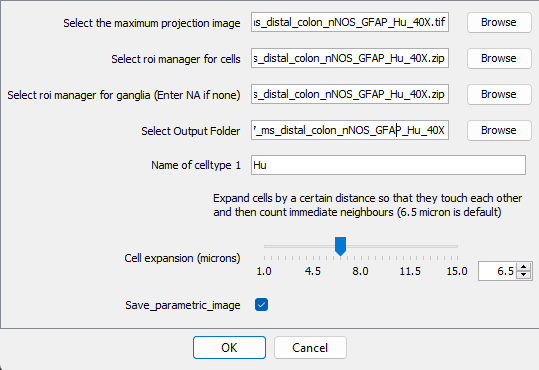
Specify the cell expansion radius, which should be 6.5 µm by default, but you can try other values if needed
If you want to save an image where each cell is colour coded, where intensity correlates to the number of neighbours, tick
Save_parameteric_image.Click Ok and it should perform the analysis and save results in the specified folder.
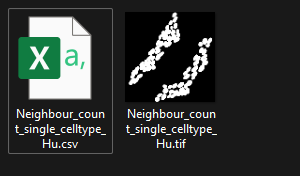
The folder will have two files:

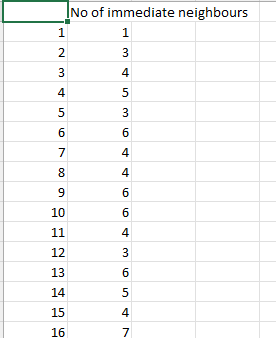
The table will display the number of neighbours around each neuron.

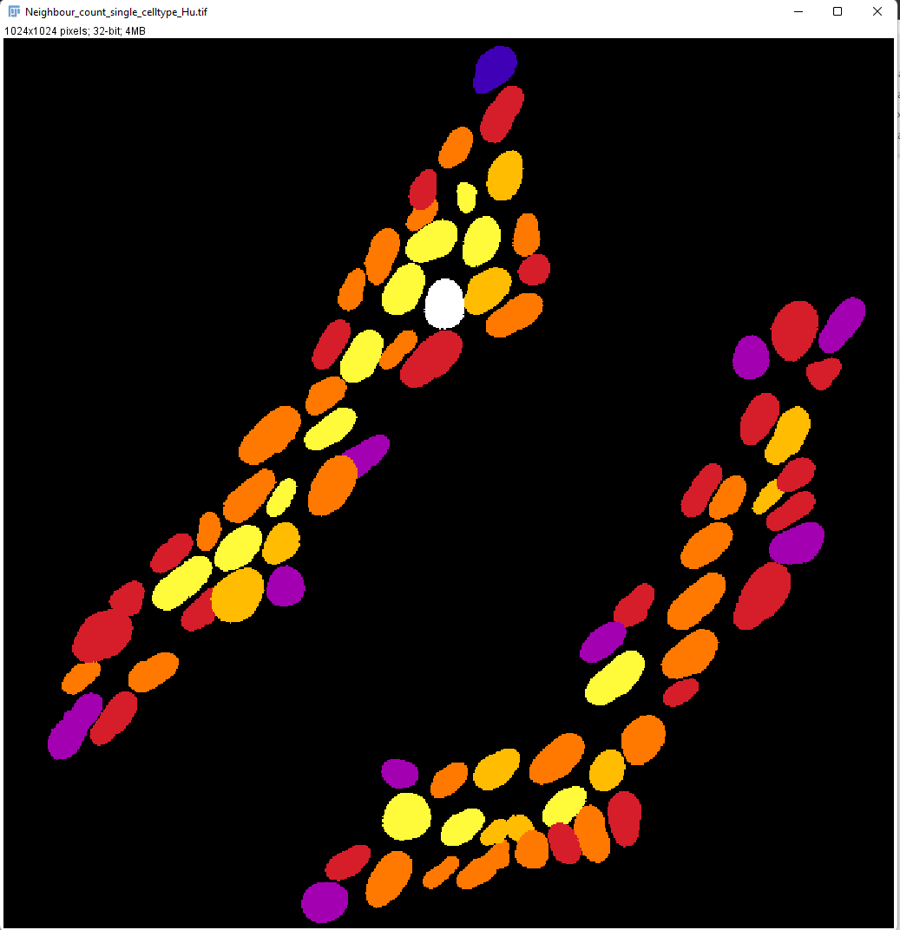
You can save a parametric image where each neuron will be colour coded (Fire LUT is used):
You can attach a calibration bar specifying the number of neurons around each cell as well by going the menu within FIJI -> Analyze -> Tools -> Calibration Bar.
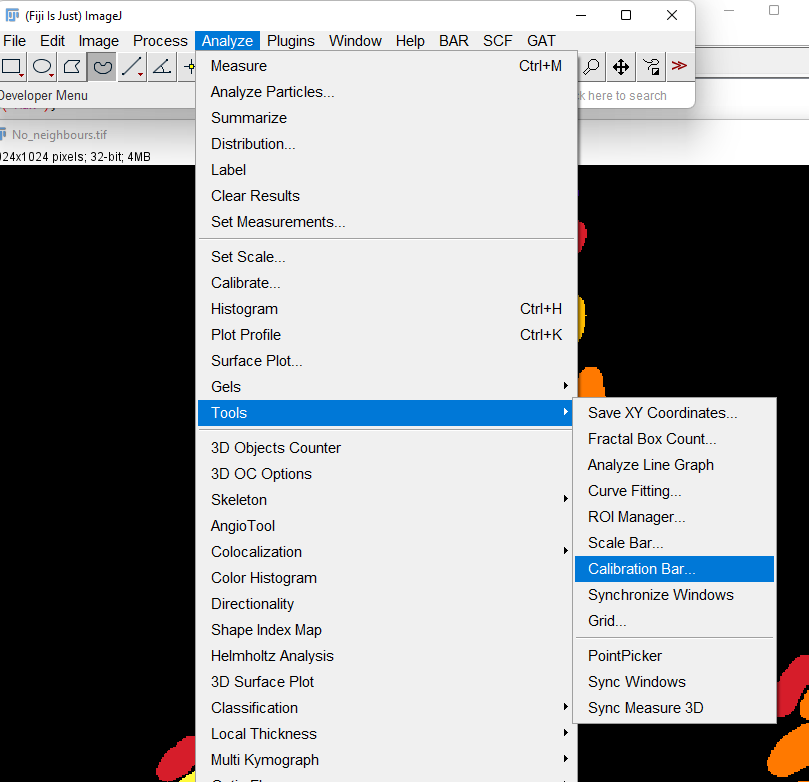
You can specify the properties of the calibration bar in the menu

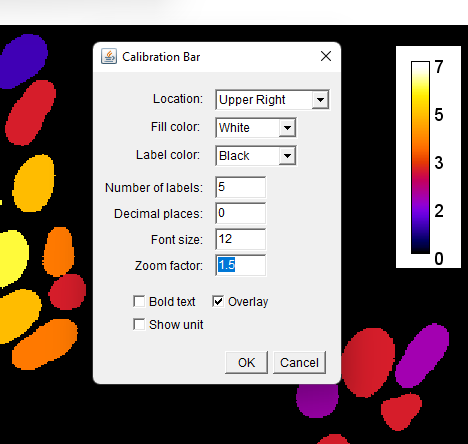
This is a intuitive way to visualize the distribution of cells.
For example, using the sample image of myenteric wholemount from mouse proximal colon: DYM_22_7_Pr_Chat_BYFP_DIN_GFP-g_nNOS-m_VIP-r_Hu-b.tif
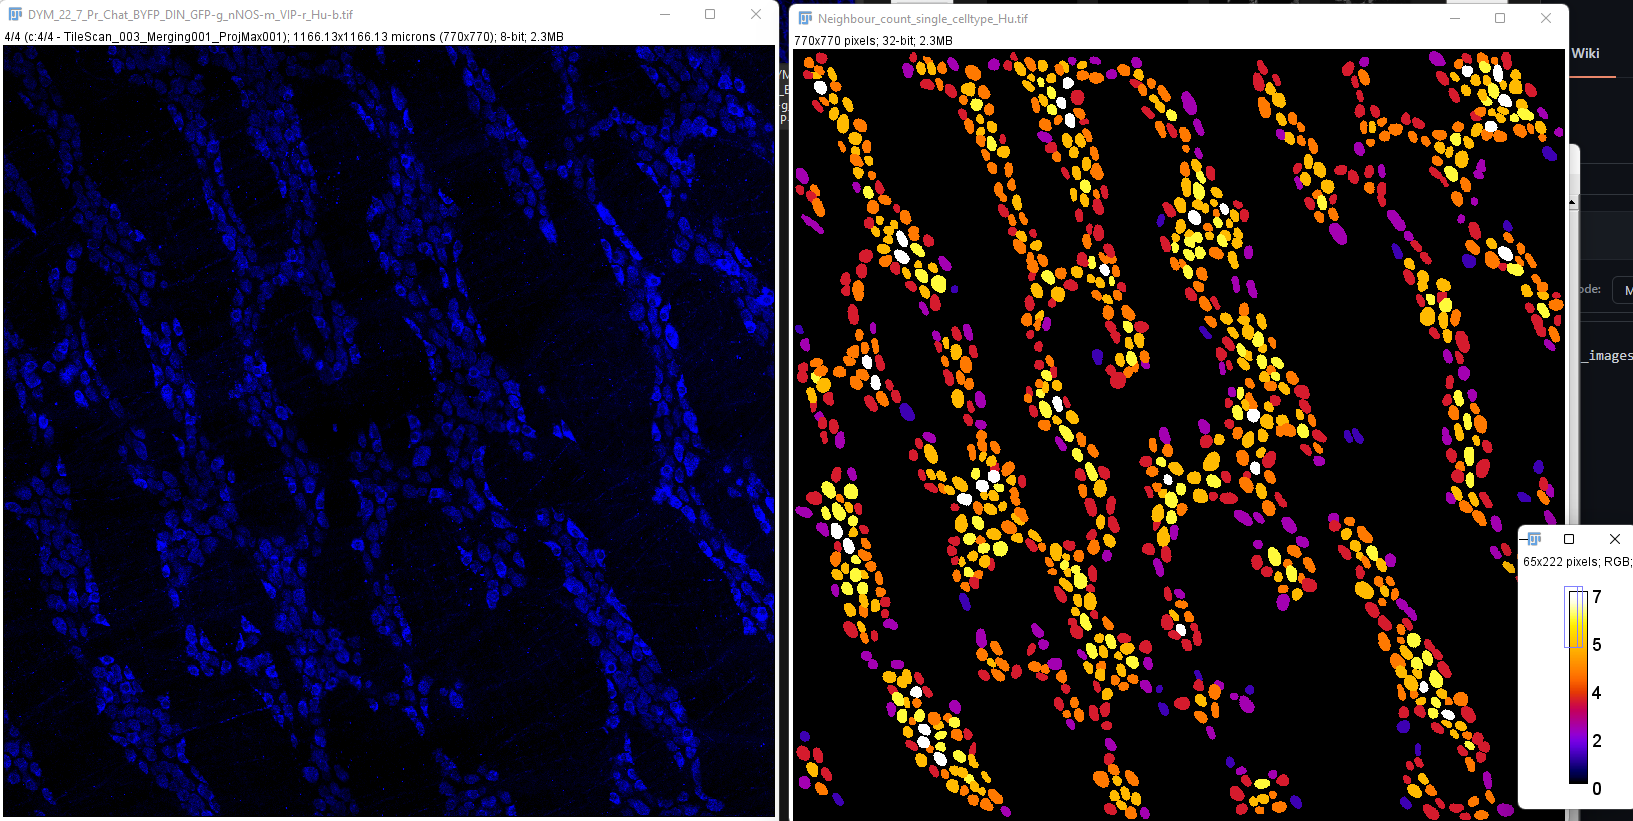
Note: This analysis can be extended to any marker or celltype as long as you have the corresponding ROI manager and the original image
3.1.2 Two celltype analysis
We will be using the same dataset: 181107_ms_distal_colon_nNOS_GFAP_Hu_40X.tif for this analysis, where the distribution of nNOS neurons will be examined. If there is a change in number of nNOS neurons, you should see a change in the number of nNOS neurons that surround every other neuron (Hu).

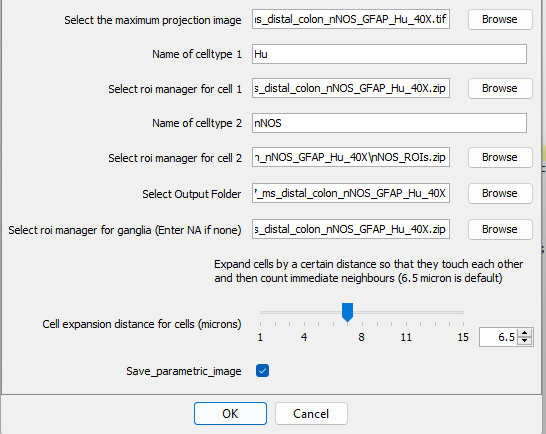
The differences here are the need for two ROI managers, one for
celltype 1, in this caseHuand thesecond celltype,nNOS. Enter the path for each file and the name of the markers of interest.Once the analysis is performed, 3 files will be saved in the results folder

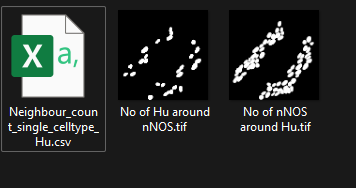
The
csvfile will show the distribution ofcelltype 1andcelltype 2in relation to each other:Number of nNOS around each Hu
Number of Hu around each nNOS

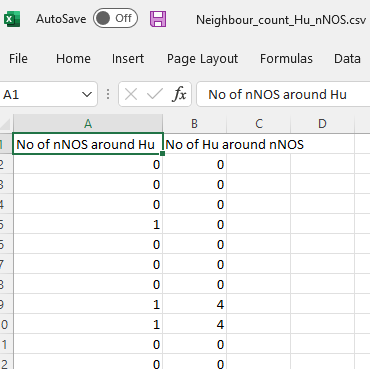
This is also useful if you are interested in 2 distinct cell populations as well, for example, ChAT and nNOS. You can study the distribution of excitatory and inhibitory enteric neurons in relation to each other. You can also look at Chat and Hu, followed by nNOS and Hu, to study the distribution of each celltype individually.
The parametric image produced for no. of nNOS around each Hu (neuron) is shown as an example (calibration bar added manually):

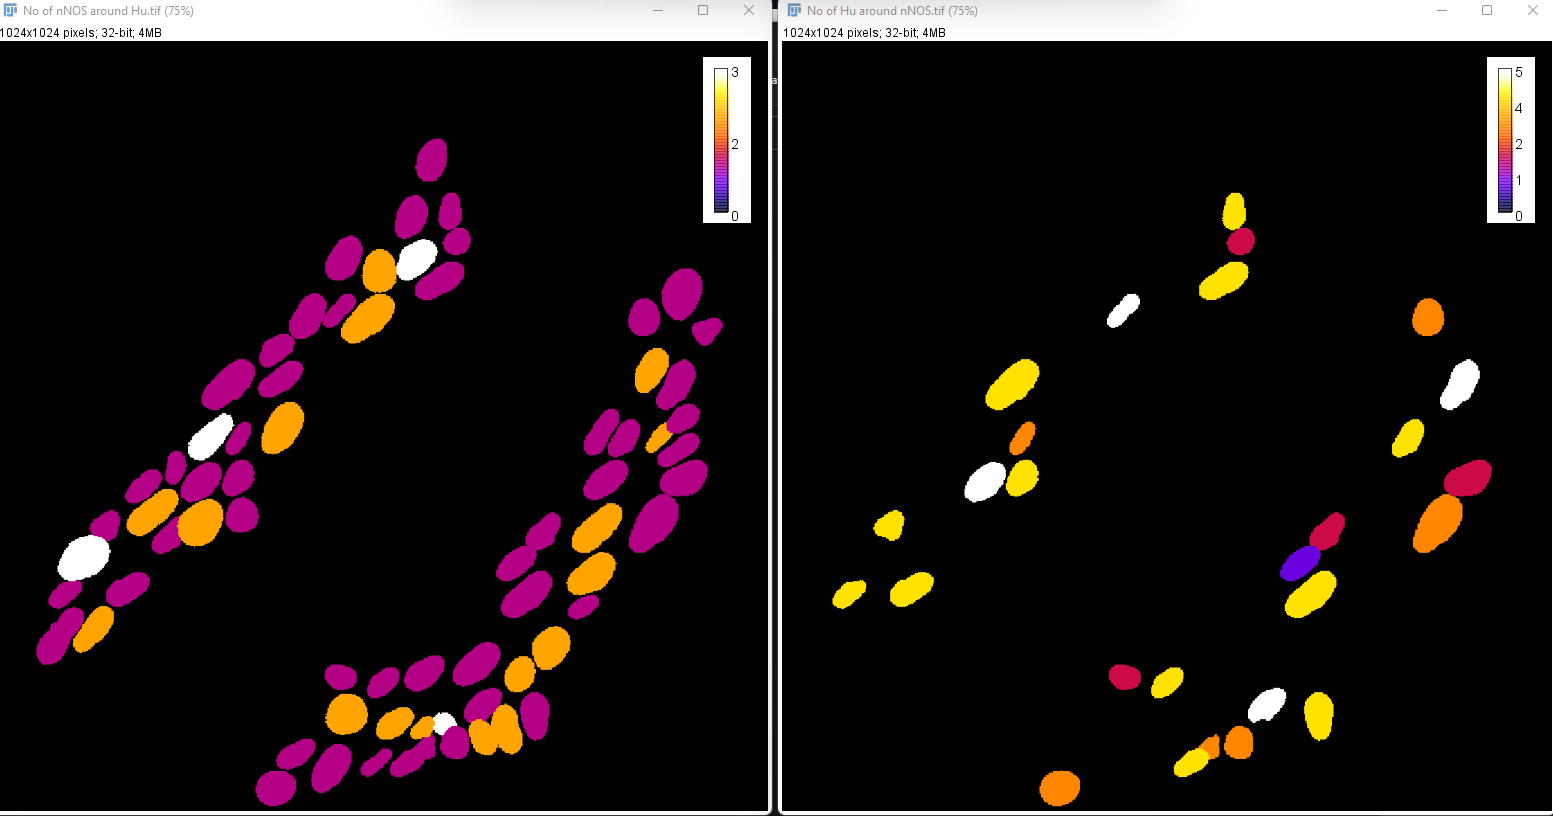
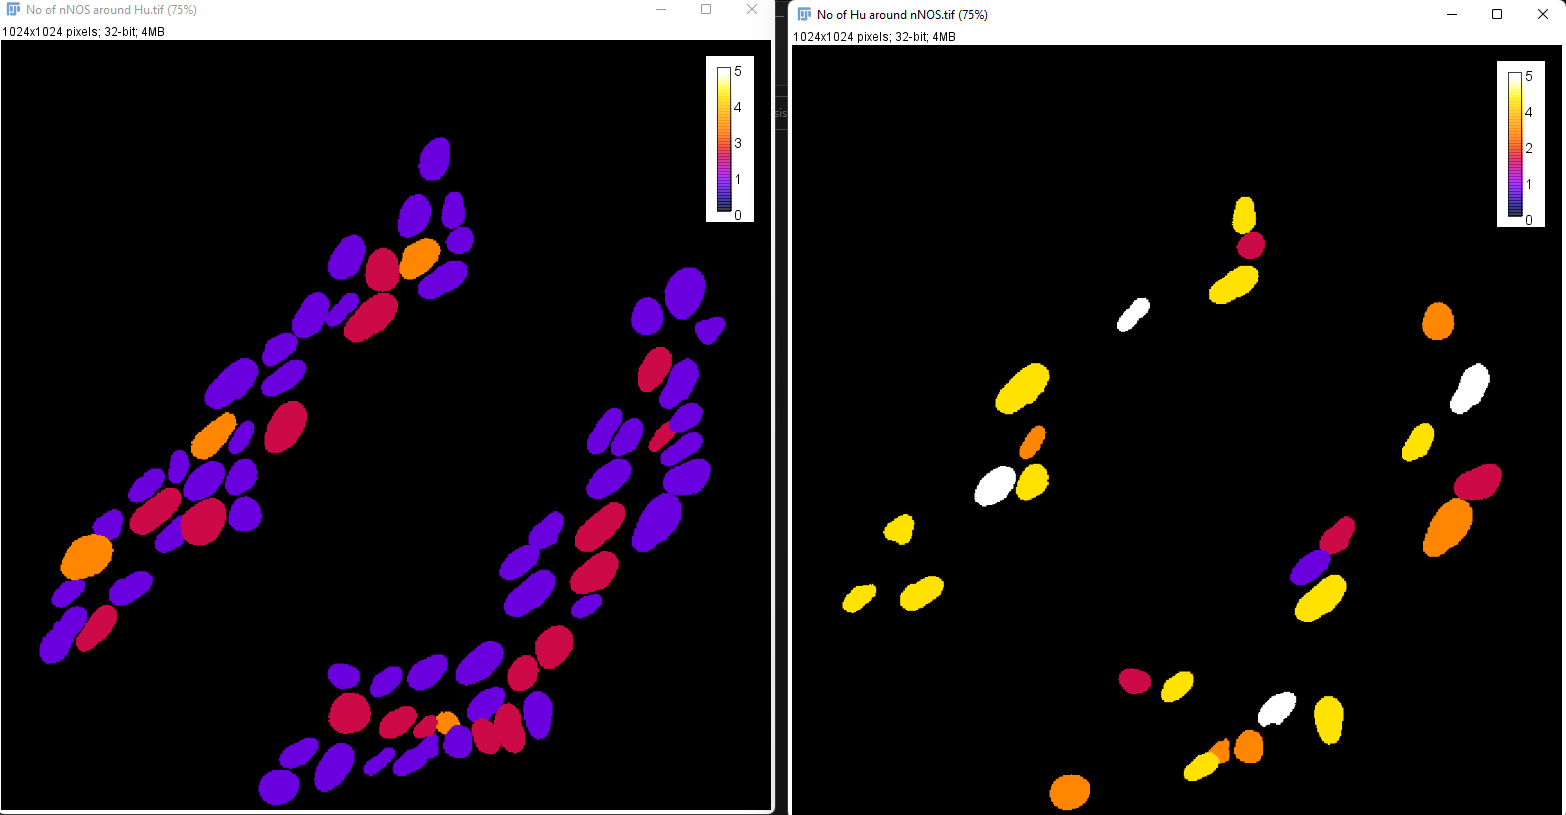
You will notice that the calibration bars will only display the maximum value for each individual image, which it makes it harder to compare. If both images were set to a maximum of 5, they can be comparable.
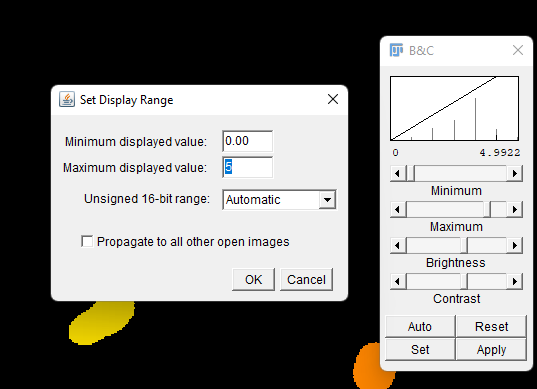
This can be done by going to
Image->Adjust->Brightness/Contrast.Click
Setand change the Maximum displayed value to 5 or whatever value you'd like.

Now, both images have the same calibration bar making them comparable.

3.2 Number of cells per ganglia (frequency distribution)
When performing the neuronal analysis with ganglia segmentation enabled, the number of cells per ganglia is also determined for every image. This can be performed for a neuron (Hu) or even for any neuronal subtype. One way to present the data is to find the Mean and standard deviation, and present it as a box plot. In addition to this, frequency distributions can present more insight into any changes in cellular distribution in disease or even across regions of the gut.
Write up in progress..
TO be added:
Distal colon vs Proximal colon comparison
Frequency Distribution graphs
How to interpret results
Calibration bar tips: RGB, save Cbar separately for publication
The spatial analysis is work in progress. Documentation will be updated soon...
References
The distance analysis is possible due to CLIJ and CLIJ-assistant
Last updated